 TakeFlight
 Renko LegStats
A Renko chart tells you a leg happened. It doesn't tell you what was in it.
Why I built it
LegStats labels every completed leg right on the chart: count (bricks on Renko), points traveled, total volume, net delta. The developing leg gets a running label that updates at each bar close. I built it to compare each leg's distance, volume, and net delta against the legs before it. Works on any bar type; built for TakeFlight Renko bricks.
What it does
A leg is a run of same-direction closes, reversal to reversal. The test is close to close. A bar that closes above the prior close extends or starts an up leg. One that closes below it does the same for a down leg. A bar that closes exactly level is skipped. On Renko bricks that is exactly one leg per same-direction run.
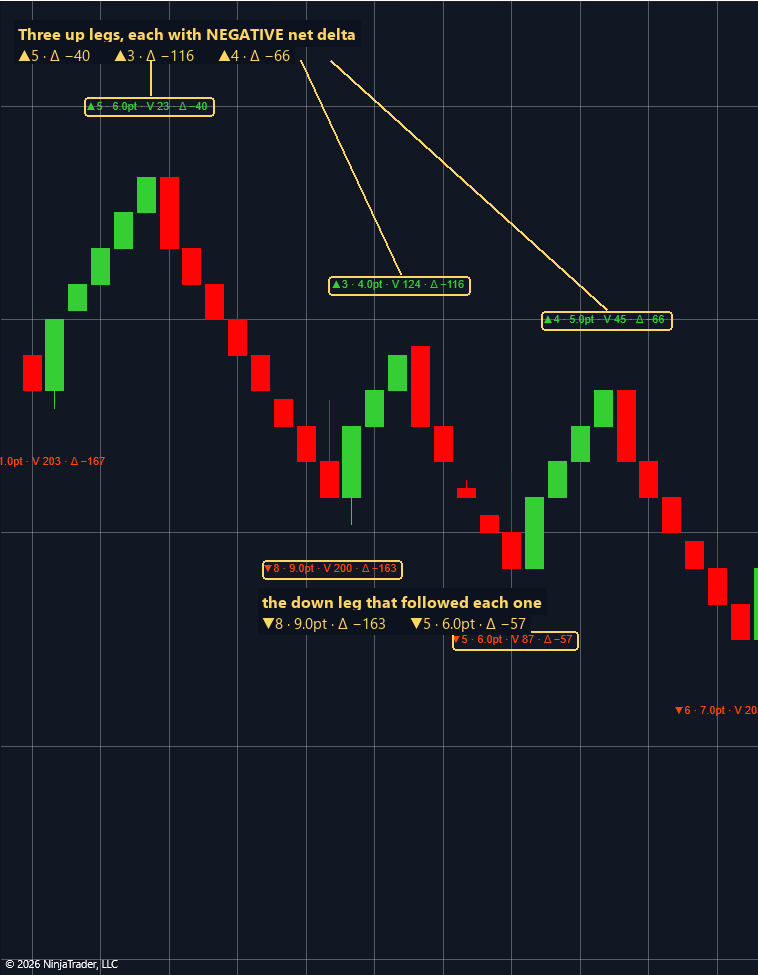
When a leg ends, its label lands at the leg's extreme close, eight ticks clear of it, LimeGreen for an up leg and OrangeRed for a down one:
▲7 · 8.75pt · V 12,480 · Δ +3,150
Four numbers. The count is how many closed bars the leg holds — bricks on Renko, bars on anything else. Points is the distance between the close the previous leg ended on and the close this one ended on. For the very first leg on the chart it is measured from that leg's opening price. Volume is the sum over those bars. Delta is buy volume minus sell volume, classified tick by tick and summed over the leg. The leg still in progress carries its own label, redrawn each time a bar closes away from the prior close, so the current push sits next to the ones before it. I wanted that comparison on the chart instead of in my head.
The delta half needs a side for every trade, so the indicator adds a one-tick data series of its own and classifies each tick against the bid and ask stamped on it: at or above the ask is a buy, at or below the bid a sell. Anything between is compared with the last classified trade: a higher price is a buy, a lower one a sell, and the same price contributes nothing. No Tick Replay. A tick that cannot be classified contributes zero to delta but still counts in full toward volume — the bars carry true volume independently of the classification. Live, a tick that arrives without a stamp falls back to the current bid and ask. Historically, delta accuracy depends on your feed shipping bid/ask stamps with its ticks. Continuum/CQG, Rithmic and NinjaTrader's own feeds do. Where a stamp is missing, the engine falls back to the comparison rule above. Turn Show delta off and the whole classification engine is skipped.
It ships as a single file. The leg tracker is built into the indicator, so there is nothing else to install and nothing else to keep in sync.
Settings that matter
Both switches are the indicator's own inputs, edited in the NinjaTrader Indicators dialog (right-click the chart > Indicators...) when you add it or any time after. Calculate is in the same dialog.
| Setting | Default | What it changes |
|---|---|---|
| Show volume | on | Appends the leg's total volume to each label. |
| Show delta | on | Appends net leg delta to each label, and runs the tick classification engine that computes it. Off skips that engine entirely. |
| Calculate | On bar close | The default, and the mode the indicator expects: each closed bar is processed exactly once. |
Install
- Unzip, then copy
TakeFlightRenkoLegStats.csintoDocuments\NinjaTrader 8\bin\Custom\Indicators\. Do not use Tools > Import — the zip is a plain file set, not a NinjaTrader export. - In NinjaTrader: New > NinjaScript Editor, then press F5 and wait for "Compile successful". On this first compile NinjaTrader appends its own auto-generated code region to the file; that is normal.
- Open a chart, right-click > Indicators..., find
TakeFlight Renko LegStats, add it, OK.
Requires NinjaTrader 8 desktop. The delta labels need a feed that supplies tick data, which every mainstream futures feed does.
What it is not
LegStats measures and labels the finished legs and the one still running. It draws text on the chart, writes nothing to disk, and places no orders. It does not tell you what or when to trade. It computes and displays; the decision is yours. Futures trading involves substantial risk of loss.
Built custom. I do this for hire — fixed quote, most jobs under a week. Get a quote →
Charts on this page show the tool, not trade recommendations. Any figure derived from backtesting or simulation is hypothetical — full risk disclosures.