 TakeFlight
 TakeFlight TPO
I built it because I could not find delta represented in a TPO chart for NinjaTrader.
Why I built it
Delta provides a lot of advantages, and I wanted them inside the profile. I also added my proprietary fib value ruler. Each TPO letter marks one time period, and every letter carries its own bid/ask volume delta — so I can read time at price and bid/ask volume in the same view. Works on any chart interval and needs no Tick Replay, so a month of ES still loads fast. The ruler sets Fibonacci levels by where the prior session's TPO point of control, the price where the market spent the most time, sat within that session's range.
What it does
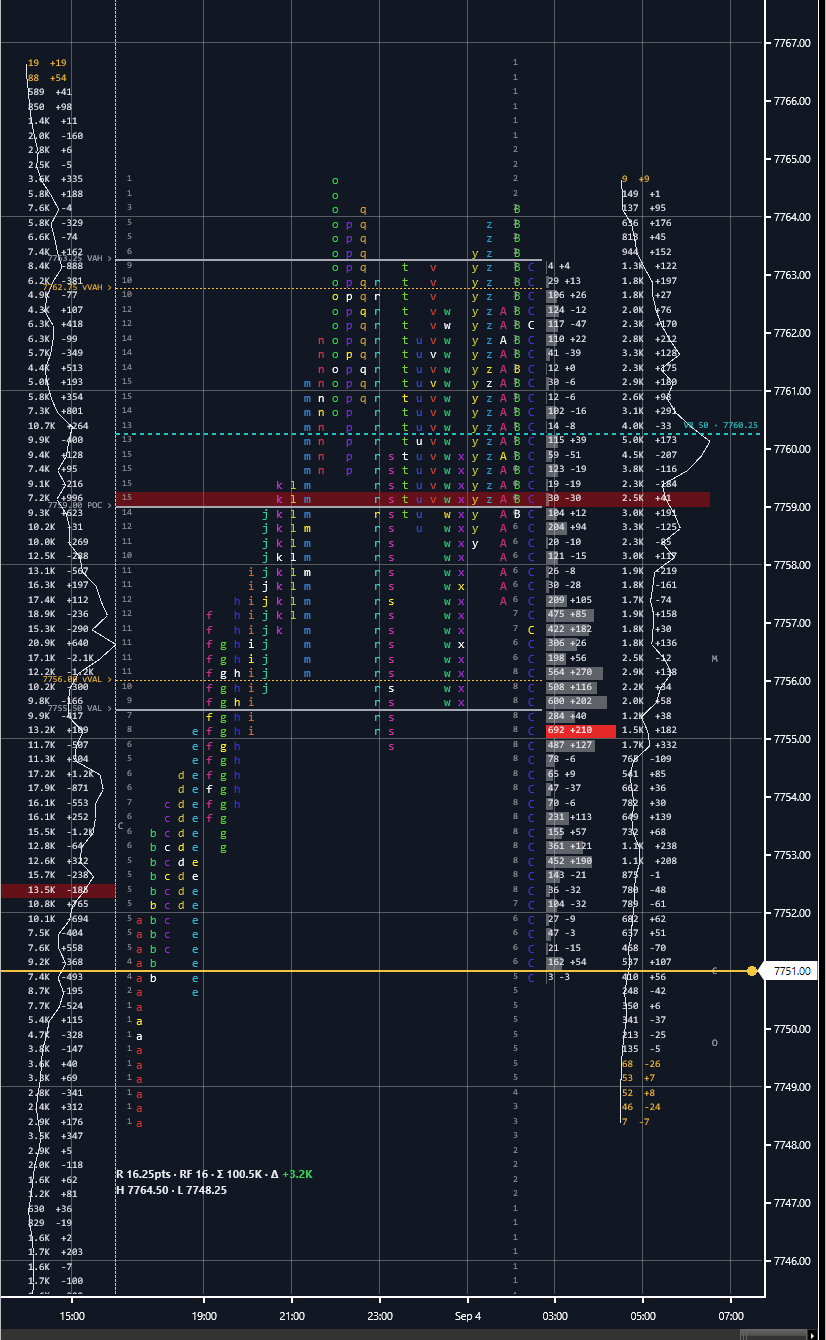
It is a profile-first view: the chart's own candles are hidden while it is applied and restored when you remove it. I wanted the delta inside the profile itself, not in a pane underneath it.
Each period is thirty minutes by default. Day-session periods are lettered from A and overnight periods from a, every period column gets its own color, and overnight letters are drawn at lower opacity. A row is one price bucket, and volume and delta are tracked per period at each price.
The delta comes from a one-tick data series the indicator adds itself. Each tick is classified against the bid and ask NinjaTrader stamped on it: at or above the ask is a buy, at or below the bid a sell. Anything between is compared with the last classified trade — a higher price is a buy, a lower one a sell, and the same price contributes nothing to delta, though its volume still counts. No Tick Replay is involved.
Right of the letter grid the live session's newest period gets its own volume sub-profile, then a column of each row's session volume with its signed delta. Solid lines mark the session POC and the value-area high and low; dashed lines mark the volume-based value area and, on a day session, the initial balance. A footer under each profile prints range, initial-balance width, rotation factor, total volume and session delta, then a second line with the high, the low, poor-extreme flags, and an unrevisited POC price. Those unrevisited POCs also draw as a short dashed marker right of the profile, tagged with the session's date, that stays until price trades through the level.
The fib value ruler. The ruler anchors on the last completed day session, and rolls when the next session opens rather than the moment that session ends. It measures how far that session's point of control sat from its range midpoint, and lays 20 / 50 / 80 levels along that displacement, repeated in blocks above and below — two by default. The 50 line is dashed, the 20 line solid, the 80 line dash-dot, and the slice between a block edge and its nearest 20 or 80 line is shaded. By default that shading stands in for the 20 and 80 labels, so only the 50 lines and the block boundaries are labeled, each with its percentage and price.
The ruler keeps a small CSV under Documents\NinjaTrader 8\TakeFlightTPO\, one file per instrument root, so a chart reload remembers which levels were already touched. Turn the log off and it stops remembering. Deleting the file is safe; it rebuilds.
Settings that matter
All of these are the indicator's own inputs, edited in the NinjaTrader Indicators dialog (right-click the chart > Indicators...) when you add it or any time after. The ruler ones sit in their own group.
| Setting | Default | What it changes |
|---|---|---|
| Period minutes | 30 | Minutes per TPO letter. |
| Ticks per row | 1 | Height of one profile row in ticks. Widen it on instruments where one tick per row is too fine to read. |
| Value area % | 70 | Share of the session's TPO count the value area covers, expanded out from the POC. |
| IB periods | 2 | How many opening periods the initial balance spans. Day sessions only. |
| ETH profiles | on | Builds a separate overnight profile. Off drops overnight ticks entirely. |
| RTH start (chart tz) / RTH end (chart tz) / ETH start (chart tz) | 08:30 / 15:15 / 17:00 | Session boundaries, compared against the chart's own timezone and not converted. Change them if your chart is not on US Central. |
| Hide chart bars | on | Hides the host chart's candles while the indicator is applied. |
| Show value ruler | on | Draws the fib value ruler off its anchor day session. |
| Ruler use Volume POC (else TPO POC) | off | Off anchors the ruler on the TPO point of control — the price with the most letters. On anchors it on the volume point of control instead. |
| Ruler write forward-log CSV | on | Writes the touched-level log that survives a chart reload. |
Install
- Save the TakeFlightTPO zip from your delivery email. Do not unzip it — NinjaTrader reads the zip directly.
- In the Control Center: Tools > Import > NinjaScript Add-On..., select the zip, Open.
- NinjaTrader imports and compiles it, and confirms when done.
- Open a chart, right-click > Indicators, and look under TakeFlight > TakeFlightTPO. Add it.
- Leave Tick Replay off — it gains you nothing here and will make a month of ES crawl. Set Days to Load to cover the sessions you want; start with 5.
Requires NinjaTrader 8. Built and tested on 8.1.x.
What it is not
TakeFlight TPO draws what the market did. The value ruler is a map, not a signal: it marks where value sat and where the market is relative to it. The indicator does not give trading advice, does not tell you what or when to trade, and makes no claim about profitability. Futures trading involves substantial risk of loss.
Built custom. I do this for hire — fixed quote, most jobs under a week. Get a quote →
Charts on this page show the tool, not trade recommendations. Any figure derived from backtesting or simulation is hypothetical — full risk disclosures.